Loading Data...

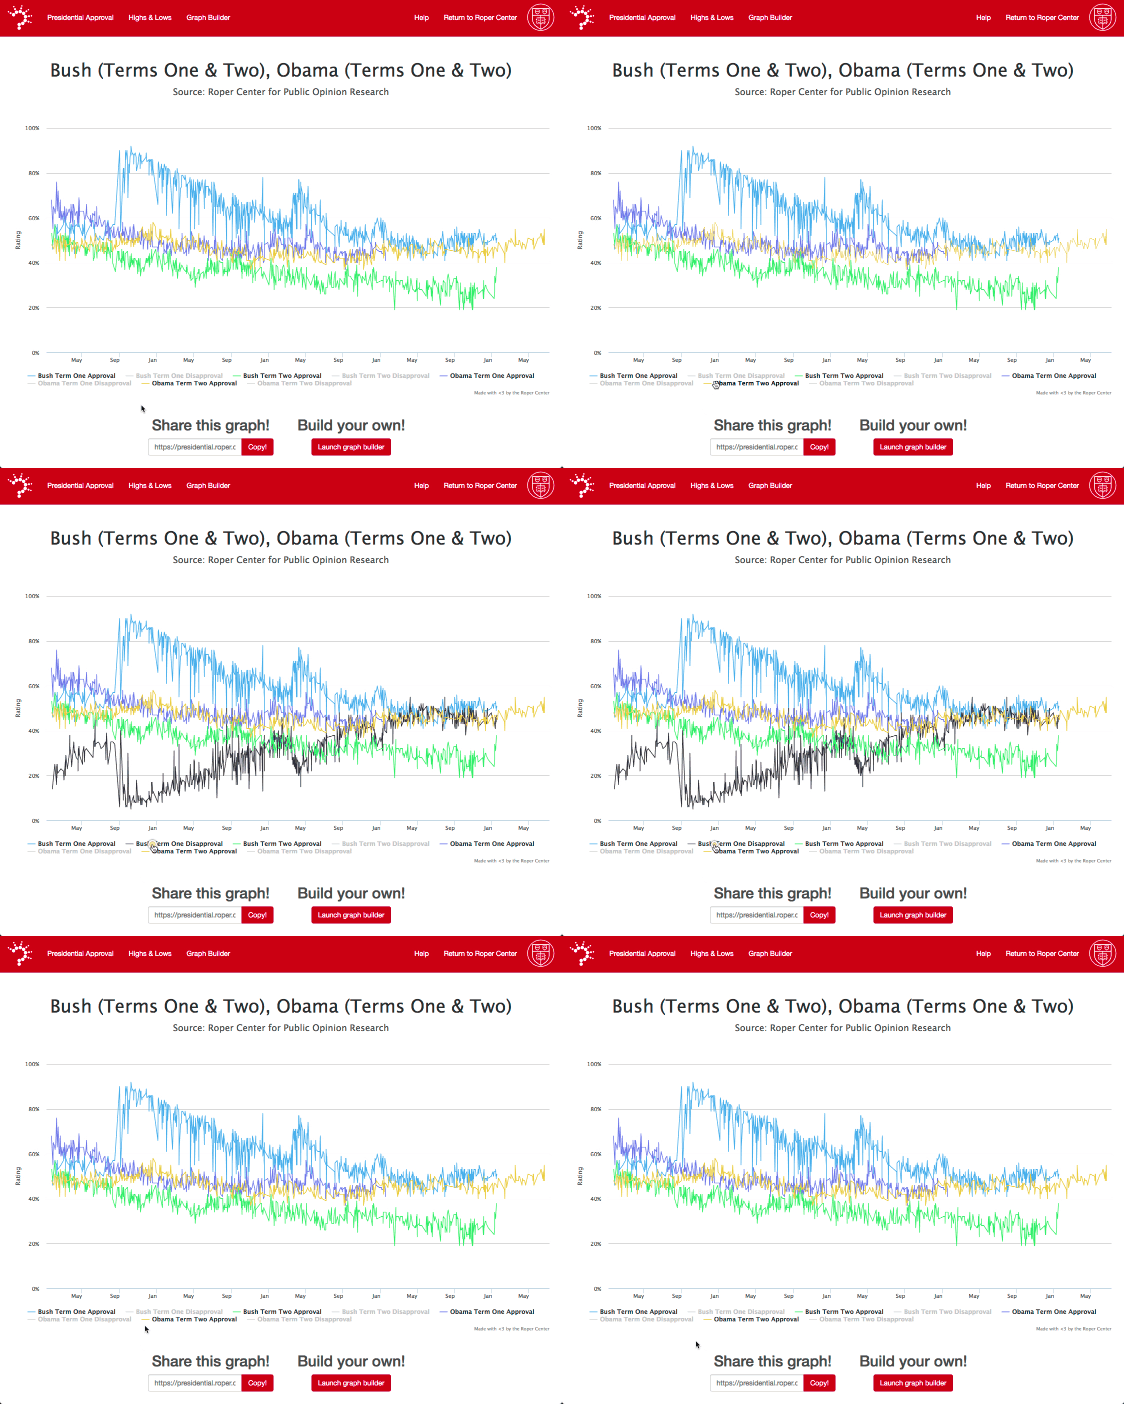
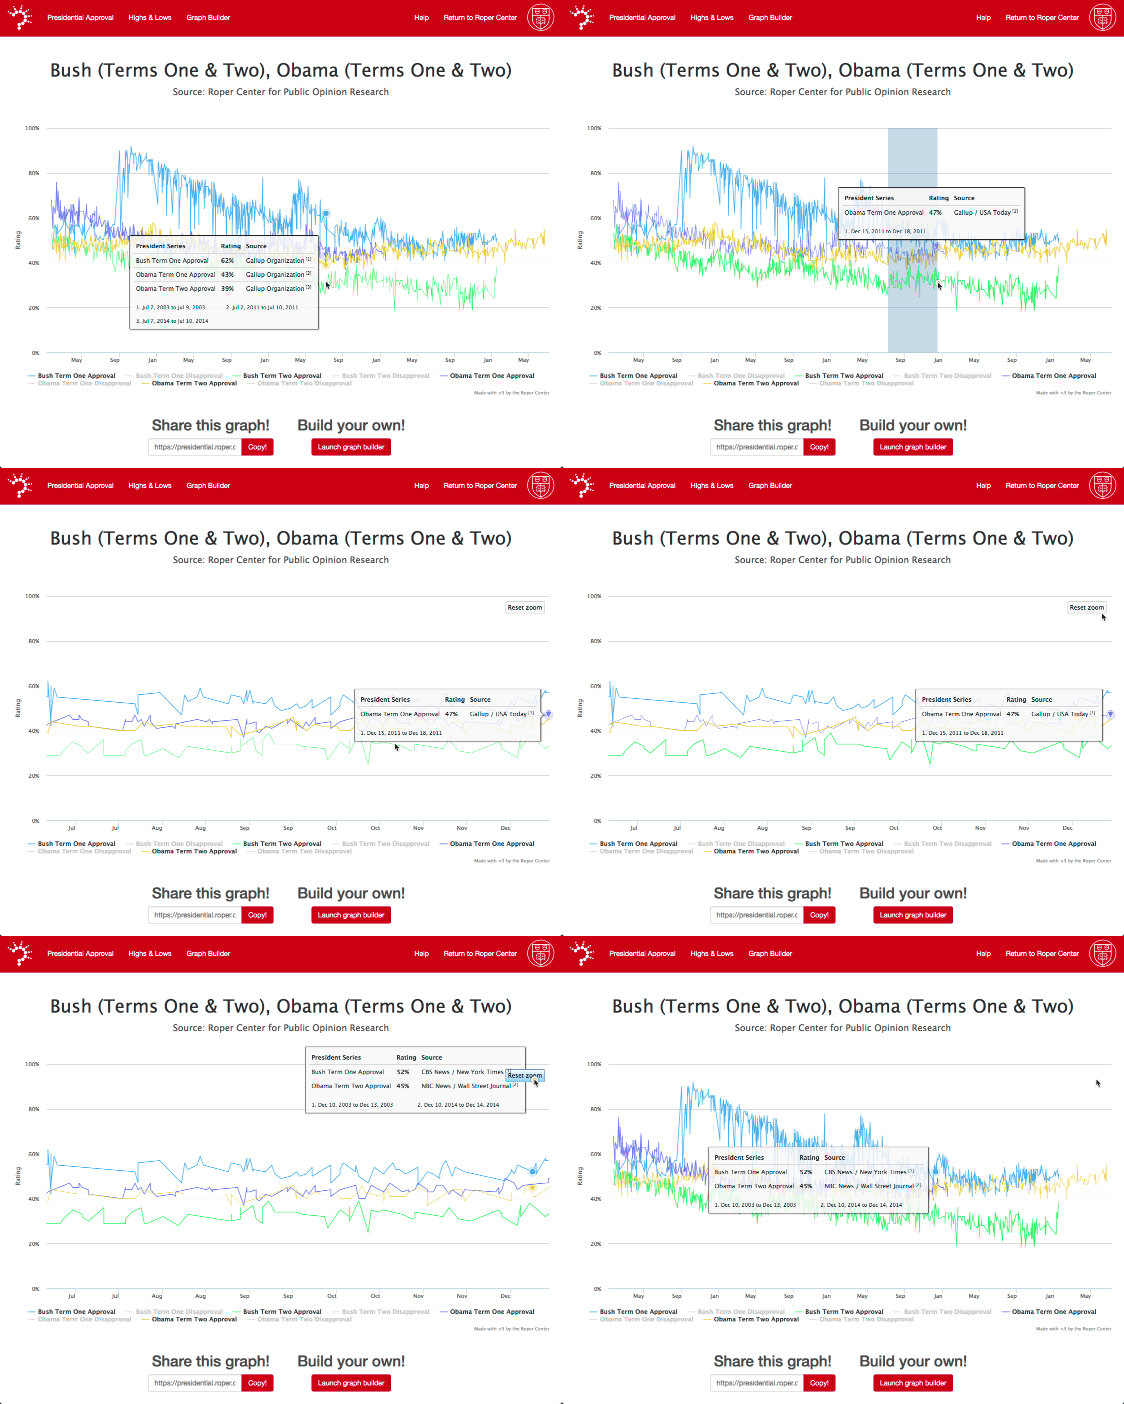
* This chart includes questions from our Longstanding Methods Collection only (U.S. national probability-based polls, conducted with live interviewer if telephone).

* Those who lean toward approving or lean toward disapproving are included in the net approve and net disapprove totals, for organizations who asked which way respondents who were undecided or refused to answer leaned.

* For visualization purposes, Roper uses dashed or dotted lines to connect data points with gap periods of more than two years in all trends, including term gaps in presidential approval, to remind researchers that changes in public opinion may not be linear and gap periods can mask unmeasured changes. Find additional approval ratings for gap periods between terms in Roper iPoll.

See RoperTrends for more Presidential approval data.
Users at member institutions can request a spreadsheet containing the data from this chart by emailing presidential-approval@roper.center.
Having trouble accessing information on this website or need materials in an alternate format, contact support@ropercenter.org for assistance.

Share this graph!

Build your own!

Launch Graph Builder