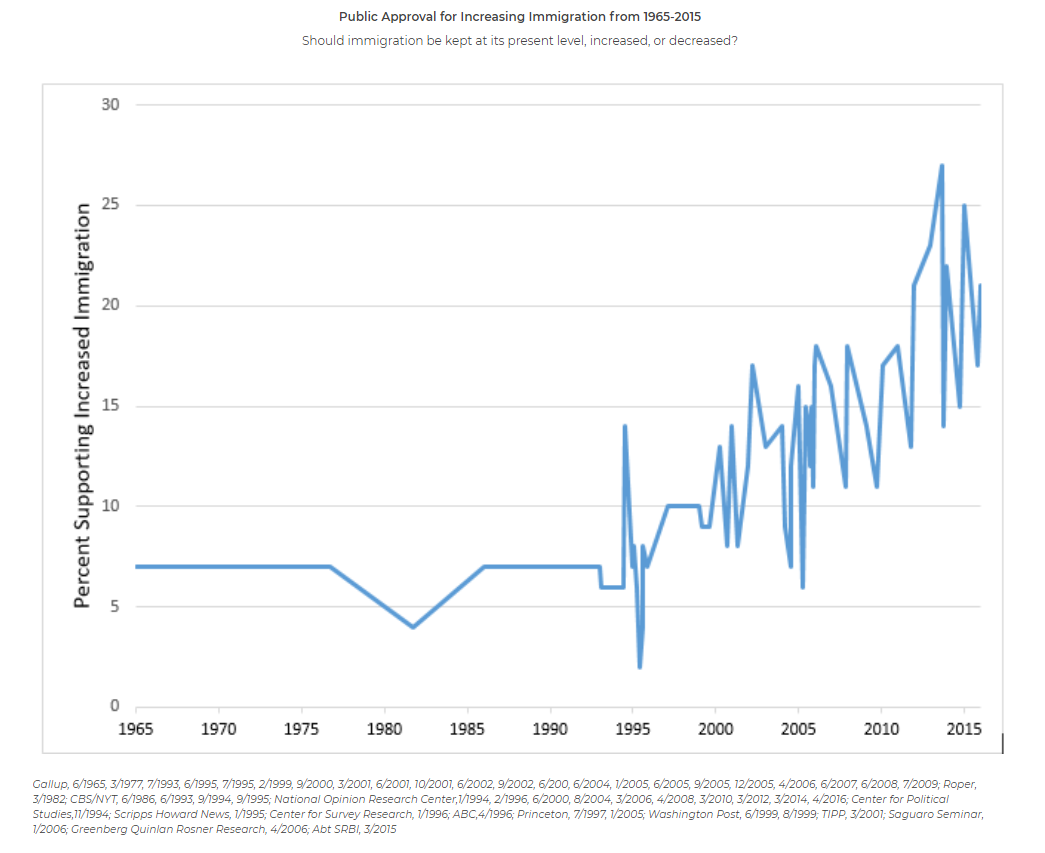
To trace recent American attitudes on immigration, I compiled 60 iPOLL survey questions from September 1964 to June 2016 that asked either the following question (or a close variation): “Should immigration be kept at its present level, increased, or decreased?” The figure above reports the percentage of respondents who indicated that immigration should be increased. Though most of the data points are concentrated after 1993, the percent who indicated that immigration should be increased has steadily grown over the past two decades. However, this pattern sheds little light on the intense partisan polarization seen and heard today. How can the increased favorability shown above be reconciled with the furious rhetoric of current public debate around immigration?
The answer may be found by determining exactly whose attitudes changed over this period. To better understand support for immigration among different groups, I compared two survey datasets from July 1993 and March 2015, which asked a variety of questions in similar ways. Within this comparison, I explored the role of partisanship in two parts: first, the general question about whether immigration should be increased and second, the evaluations of different immigrant nationalities. Both current news headlines and formal reports paint immigration as a deeply partisan issue, but this state of affairs is in fact a product of decades of change.
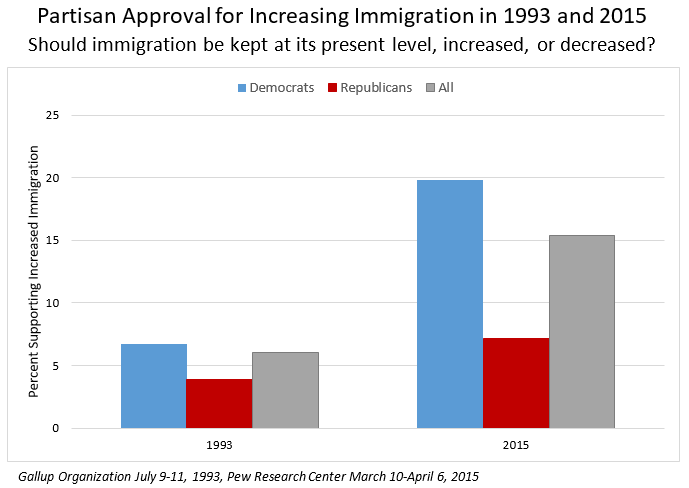
The figure above shows a dramatic shift in the role that partisanship plays in immigration support. In 1993, only 6% of all respondents indicated that immigration should be increased, but this proportion did not differ greatly between parties. Approximately 7% of Democrats supported increasing immigration, compared to 4% of Republicans. By 2015, however, the overall increase in support is accompanied by a drastic increase in partisan divide. Approximately 15% of all respondents indicated support for immigration - a climb from 6% that is largely owing to the 20% of Democrats who supported immigration. Among Republicans, support only increased by 3%, compared to a 13% increase for Democrats.
Only looking at the overall increase in support thereby obscures the widening in partisan differences. Though immigration support has indeed increased among all respondents, the magnitude of such change is far greater for Democrats than Republicans. This partisan breakdown not only qualifies our initial findings, but also suggests that perceptions of increased partisan polarization seem to be true.
Does partisanship have equally strong effects on other aspects of public opinion about immigration? The history of U.S. immigration is rich with diversity, and both formal policy and popular attitudes have responded in different ways to different groups of immigrants. The first iteration of the federal immigration system was based on differential treatment of immigrants’ national origins, and nearly a century later, President Trump’s January 2017 travel ban specifically included eleven “high-risk” nations—nearly all majority-Muslim. An increasing proportion of the public, and especially Democrats, support increasing immigration in general—but what types of immigrants? How do partisan differences affect opinions of different groups of immigrants?
In addition to measuring general support for immigration, the 1993 Gallup survey also asked about specific immigrant groups with the following question: “Do you think the number of immigrants (people who come from other countries to live here) now entering the U.S. from each of the following areas is too many, too few, or about the right amount?” The survey then asked about a series of geographic regions: European, Asian, Latin American, and African countries. This survey question did not appear in the 2015 survey, but was fielded in four other surveys from Gallup, Princeton/Newsweek, and AP/GfK from 1992 to 2015.
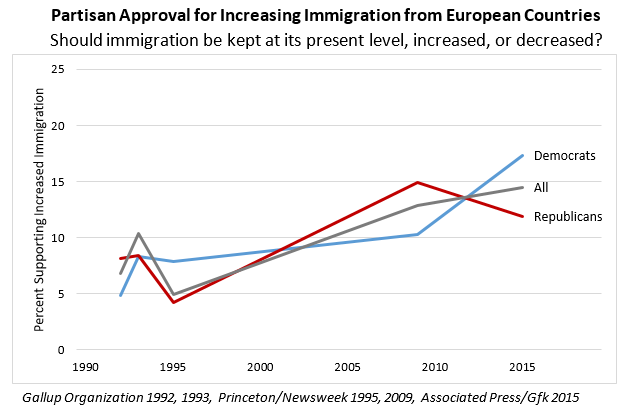
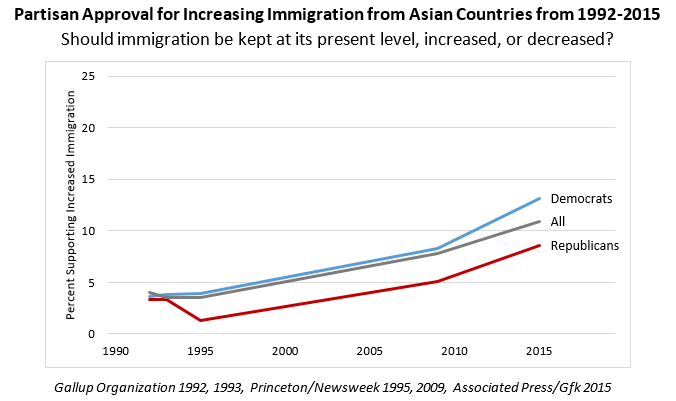
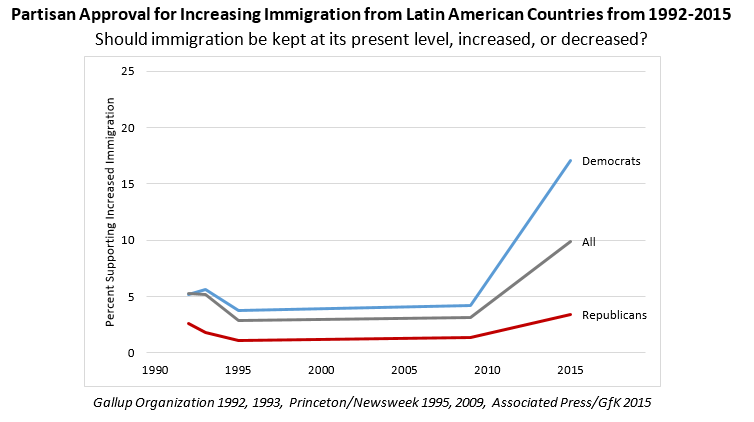
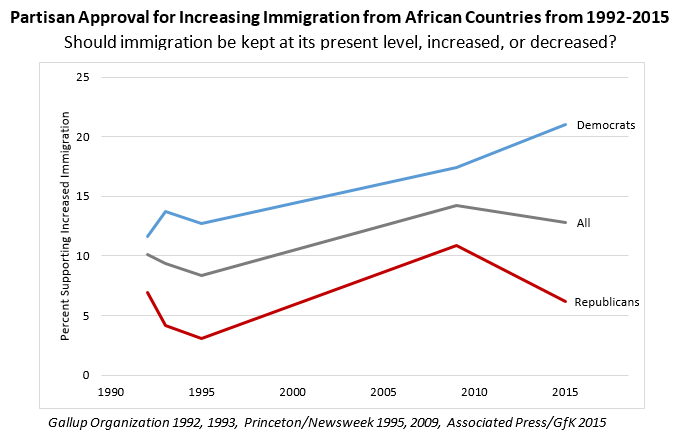
The figures above show the shifts in immigration support for specific groups of immigrants. Each shows the percentage of respondents who indicated that the number of immigrants from each region was too few. That is, each shows the recent trend of support for immigration from each region. For all regions, the percent supporting immigration has increased to match our previous findings. However, as before, partisanship reveals key distinctions.
For European and Asian countries, the percent of Republicans and Democrats who support increased immigration closely aligns with the percent overall to suggest a greater consistency towards Asian and European immigrants across party lines. In both 2009 and 2015, the difference between Republican and Democratic support for European immigrants does not exceed 6%, and for Asian immigrants, 5%. This is not the case for Latin American and African countries; in 2009, the percent difference in partisan support did not significantly differ from Europe and Asia, at approximately 3% for Latin American immigrants and 7% for African immigrants. But in 2015, this difference greatly increased; the percent of Republican respondents supporting Latin American immigration increased from 1% to 3%, whereas that of Democratic respondents increased from 4% to 17%. Overall between the two years, the partisan difference for immigration support increased by approximately 11% for Latin American immigrants, 8% for African, and a mere 1% for Asian and European.
After being broken down not only to the respondent’s partisan identification, but also the specific type of ‘immigrant’, the data reveal telling shifts in public opinion that may better inform our understanding of immigration. While attitudes towards immigration have steadily improved since the early 1990s, these changes have been far greater among Democrats than Republicans. Partisanship’s increasingly influential role suggests that, even though the survey comparisons only extend to 2015, polarization continues to be on the rise.
Of most interest, however, are the differential degrees of influence that partisanship plays in opinion on different regions, and how they do not fully align with popular media narratives. Our findings show that support for Latin American immigration has been steady and is not significantly lower than other regions, and yet from news headlines, it seems that U.S. immigration policy has specifically cracked down on Latin American immigrants. In recent months, President Trump’s attention to the US-Mexico border wall, the family separation policy, and the MS-13 criminal gang display a level of scrutiny that is not uniformly applied to other regions. While the figures explored above only provide a snapshot of the shifts in immigration support, they nonetheless suggest that an ever-widening partisan difference may be influencing popular perceptions and narratives of immigration.