That’s what makes the Cornell course Taking America’s Pulse unique. Students design, conduct and analyze a nationally representative survey of more than 1,000 respondents in a single semester. Students control every step of the process.
The course, officially named “GOVT/COMM 3189: Taking America’s Pulse: Creating and Conducting a National Opinion Poll,” aims to provide students with a fully hands-on introduction to survey research methods and data analysis. It has been offered four times to date: in the Spring 2014, Spring 2015, Fall 2016, and Fall 2020 semesters. The course has been co-designed and co-taught by Professors Peter Enns and Jonathon Schuldt, the former and current Executive Directors of the Roper Center. In 2012 when Schuldt arrived as an assistant professor at Cornell, they recognized a need for a new course to teach survey research skills.
“At the time, Cornell had a program called the University Courses Initiative,” Enns said. “Its goal was to fund new and innovative course proposals that would draw students from Cornell’s many different colleges and majors to learn alongside one another.”
“Because public opinion research is a core topic in both Government and Communication, we thought of developing a course that incorporated active learning and the intellectual perspectives of our two departments—which sit in the College of Arts and Sciences and the College of Agriculture and Life Sciences respectively—would be a great opportunity for students,” Schuldt added. “Luckily, the University Courses Initiative agreed to fund the course.”
Since Spring 2014, the course has enrolled a total of 189 students hailing from six of the seven undergraduate colleges at Cornell and every class level, from first-year to senior. This was intentional, as the course was designed without prerequisites. “We set out to teach students everything they need to know about survey research and analysis in one semester, from soup to nuts,” Enns said. “It’s pretty ambitious but the results have been amazing.”
This diversity of student backgrounds has shaped the overall topics of the survey questions. Over the years, there have been recurring interests in topics of sports and athletics, entertainment media, technology, social media, the environment, government and politics, education, and health.
The Coursework
Each time the course is offered, the class works together to field an original national opinion survey of U.S. adults. Every student is allowed to contribute one question to the survey, offering a valuable opportunity to ask the American public anything they wish. But some steps have to happen before and after that point.
The course begins by introducing students to the many uses of high-quality survey data in society, including in academic, policy, for-profit, and non-profit settings. Students are then introduced to the scientific method and the process of using data to answer research questions. It then covers principles of questionnaire design and strategies for interviewing survey respondents, including ways to avoid biasing the responses. This topic was especially critical in 2014 and 2015, when the class partnered with Cornell’s Survey Research Institute to have students personally conduct five phone interviews lasting about 20 minutes, on average (this requirement was dropped when the survey shifted to online data collection beginning in 2016). 
Once the data are in-hand, the focus shifts to analysis. Assignments aim to build up students’ basic data analysis skills, everything from opening the software package and importing data, to labeling and re-coding variables and generating frequency tables and crosstabs for the results.
In the latter part of the course, students put their newly acquired analysis skills to use in two major assignments: an op-ed essay that uses data from the class survey that students submit to a potential publisher, and a conference-style poster presentation that students complete in groups of 4 or 5. Over the years, students have drawn attention to some notable results through these assignments.
In recent years with the support of the David M. Einhorn Center for Community Engagement at Cornell University, the course has been revised to include a strong community engagement component, allowing students to partner with community and nonprofit organizations, ask survey questions that will provide information the organizations are interested in, and then analyze and present the results to the organization.
Notable Results
On “hidden” Trump supporters: In the lead-up to the 2016 presidential election, there was a lot of discussion of whether there was a group of “hidden” or “shy” Donald Trump supporters that was going undetected in the polls and that would emerge on Election Day to swing the contest to Trump.  Taking America’s Pulse student Alexander Rauter was interested in delving deeper into how Americans really felt about Trump and his opponent, Hillary Clinton. To do so, he asked the question, “If you had to choose one, which presidential candidate do you find to be more truthful: Donald Trump or Hillary Clinton?” Results showed that among the sizable portion of the sample (20%) who did not express an intention to vote for either Clinton or Trump, a greater number chose Trump than Clinton as more truthful (46% vs. 40%). In other words, among the critical group of voters who said they were undecided in the weeks leading up to the 2016 election, this question revealed more latent support for Trump than Clinton.
This and related findings inspired write-ups in the New York Times and Washington Post.
On attitudes toward immigration: Sally Yang, who also took the class in 2016, was interested in Americans’ attitudes toward undocumented immigrants who originally entered the U.S. as minors. Because 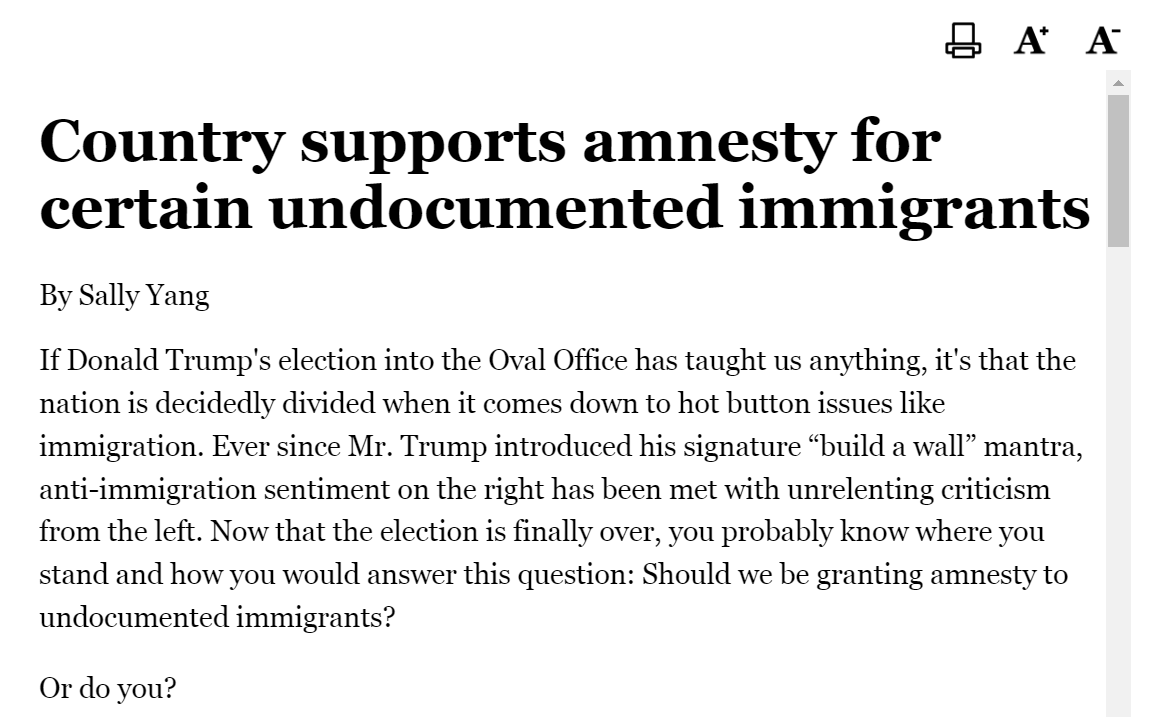 she was further curious about the potential role of question wording, she decided to conduct an experiment in which half of the respondents were asked whether “undocumented immigrants who entered the US as minors” should “be able to stay in the US” and half were asked whether they should “have to leave the US.” Analysis showed that the “stay” vs. “leave” wording didn’t affect the results. What Sally did find was strong public support for allowing those who entered the country as undocumented minors–also known as “DREAMers”–to stay in the country. This was true even for a majority of conservative and Republican respondents in the sample.
Sally wrote about these findings in an op-ed she published in the Baltimore Sun.
On the wages earned by incarcerated individuals: Many incarcerated individuals living in America’s jails and prisons perform labor in exchange for wages that are much lower than what is typical in the rest of society–often, those wages are well under $1.00 per hour. In 2020, Taking America’s Pulse student Allie Pultorak teamed up with The Marshall Project, a group of journalists who cover criminal justice, to ask Americans how much they thought incarcerated 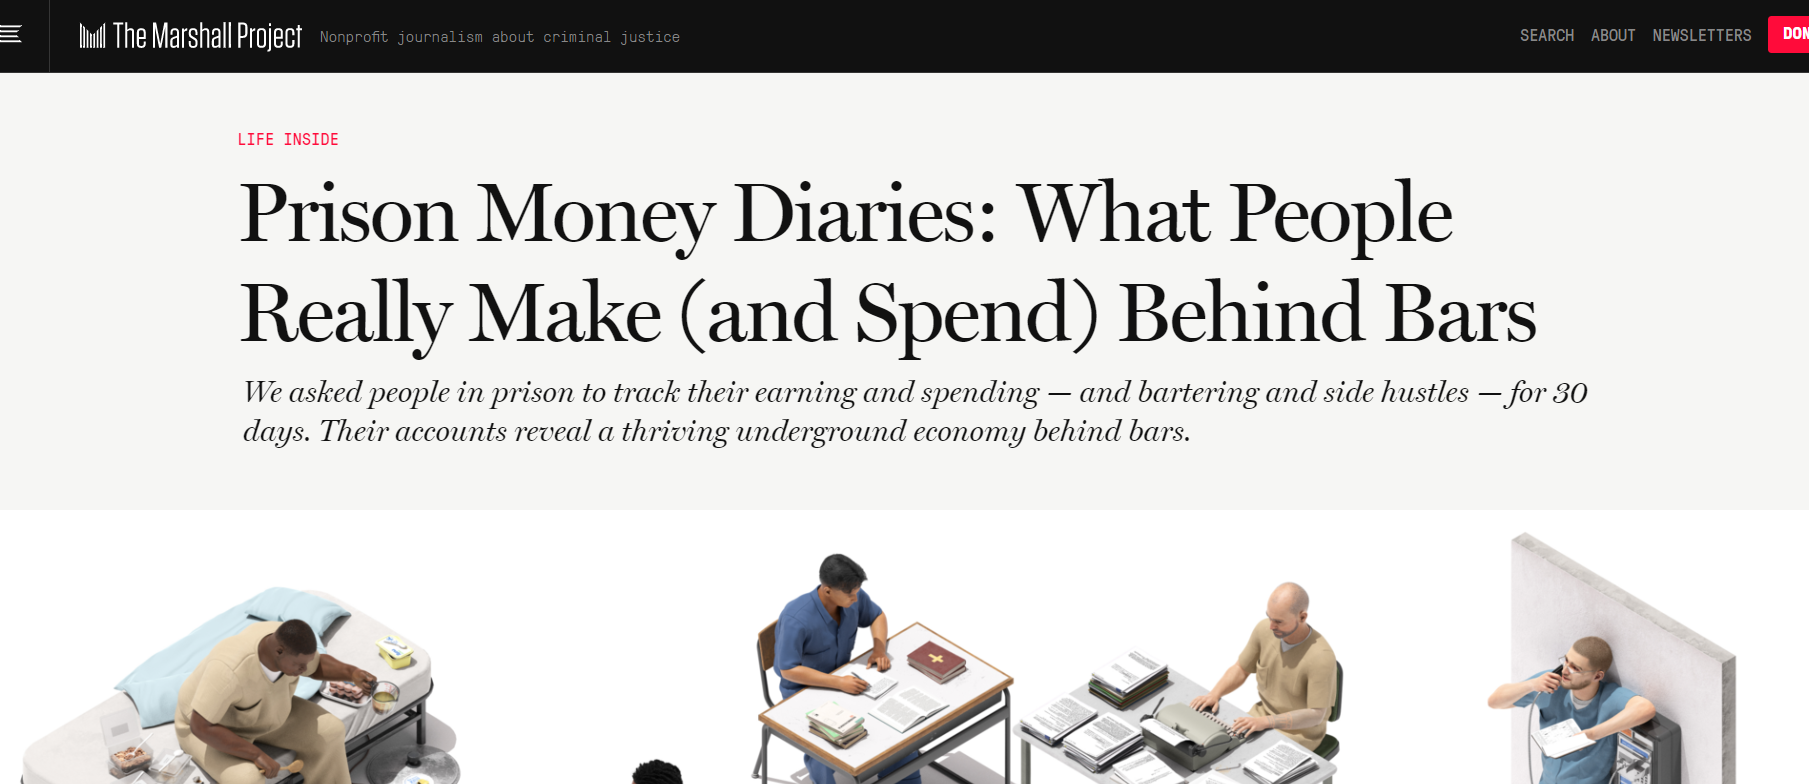 individuals should be paid for their work. The question was posed in an open-ended format, so that survey takers could say whatever wage they thought was most appropriate. On average, respondents said incarcerated individuals should be paid nearly $9.00 per hour, a number that far exceeded what incarcerated individuals are typically paid and that outpaced even the minimum wage of many US states at the time of the survey. By asking this innovative question, Allie was able to gain a unique perspective on the American public’s beliefs about what constitutes a fair wage for those performing work in jail and prison.
Allie’s survey question also helped inspire a larger journalism project by the Marshall Project exploring what people make (and spend) in prison.
Future of Taking America’s Pulse
Since the course was launched in 2014, demand for data science skills, including survey research skills, has only grown among college students and prospective employers. While offering the course is expensive given the substantial cost of recruiting high-quality survey samples, the course has benefited from the generous support of its partners, including the David M. Einhorn Center for Community Engagement at Cornell University and NORC at the University of Chicago, in addition to the previously mentioned University Courses Initiative at Cornell.
Enns and Schuldt plan to offer the course once again in the Fall 2024 semester, to coincide with the next U.S. presidential election. “The class survey provided original and important insights that help us understand the 2016 and 2020 U.S. elections,” Schuldt said. “We plan to keep that tradition going in 2024.”
Further Resources
Data from the 2014, 2015, 2016, and 2020 Taking America’s Pulse surveys are archived at the Roper Center. To learn more about the Taking America’s Pulse course over the years, please see the following articles appearing in the Cornell Chronicle:
Students take America’s pulse in course on polling
Polls produced by students reveal shifting attitudes
Voters anxious ahead of election, students’ national poll finds
Taking America's Pulse 2020 Data in iPoll
Taking America's Pulse 2016 Data in iPoll
The Roper Center thanks Emily La for assistance in preparing this post.