For further information, please contact The Roper Center at 607.255.8129 or Support at Roper.
| What is a public opinion poll? | A poll is a type of survey or inquiry into public opinion conducted by interviewing a random sample of people. | |
| What’s a random sample? | A random sample is the result of a process whereby a selection of participants is made from a larger population and each subject is chosen entirely by chance. | |
| When I receive some survey calls, they’re trying to sell me something. Is this a public opinion poll? | No. Telemarketing calls are different from public opinion polls. A telemarketer’s objective is to sell you something, rather than learn of your opinions-although sometimes he or she will disguise the motive with a few questions first. The goal of the public opinion pollster is to measure the views of the targeted sample in the population. | |
| Why haven’t I been asked to participate in a national opinion poll? | The US Census tells us there are more than 200 million American adults and most polls generally include about 1,000 respondents. If 2,500 national polls are completed each year, only 2,500,000 people will be interviewed. Assuming no one is interviewed more than once, the odds of being called in any given year are just over 1 in 100. | |
| Why should I participate in an opinion poll? | Public policy decisions are being made all the time. There are all sorts of interest groups who are making their positions known to those decision-makers. The public opinion poll provides an opportunity for the voices of the common man and woman to be heard. So, why wouldn’t you want your views represented? It’s your privilege in a democratic society! |
| What is a scientific sample? | A scientific sample is a process in which the respondents are chosen randomly by one of several methods. The key component in the scientific sample is that everyone within the designated group (sample frame) has a chance of being selected. | |
| How are the surveys conducted? | Two of the most common ways to conduct public opinion polls are telephone and/or face-to-face interviews. Other methods include mail, on-line and self-administered surveys. | |
| How is the sample selected for a telephone survey? | How is the sample selected for a telephone survey? Typically, survey organizations conducting telephone surveys purchase a Random Digit Dial (RDD) sample of randomly-generated phone numbers from a firm that specializes in designing samples that have been purged to eliminate business numbers, dead lines, etc. Much could be said on this topic, but to keep it simple, a 10-digit phone number in the United States consists of 4 parts. |
The Dissection of a Telephone Number
| (777) | 777 | 77 | 77 |
| (Area Code) | Exchange | Block Number | RANDOMLY GENERATED NUMBERS |
All 4 components are assigned by the telephone company. The first 3 components are based on location and the final component is randomly generated.
The interviewer will then randomly select a person in the household to be interviewed. One common method is to ask for the adult in the household who had the most recent birthday. This is done because it is an easy way to obtain a random respondent from the household, rather than the first person to answer the phone.
In addition, certain parts of the population, such as young males, are more difficult to get on the phone than others, such as the elderly. Because of this, interviewers often ask to speak with the youngest male in a household first.
Because nearly a quarter of the US population (as of 2014) has a cell phone but no landline telephone, true scientific samples should include a subsample of cell phone users. Cell phone sampling comes with its own unique challenges, such as higher cost and lower response rates. FCC regulations require that cell phone lines be dialed by hand, rather than computer, increasing time and manpower requirements. Geographic information is also different for cell phones, with the area code offering the only geographic information for the cell phone user, and the exchange and block numbers offering information on the service provider. In addition, the portability of cell phones means that users can keep their numbers if they move. Despite these added complications, however, cell phone sampling methods are similar to those used for landline telephones.
| How are face-to-face samples selected? | Face-to-face surveys, also known as ‘in-person’ interviews, are conducted with the interviewer and the interviewee next to each other. The interviewer reads material from the questionnaire and records the responses. At times the interviewer may hand a card to the respondent for him/her to select response(s). Scientific face-to-face surveys are normally conducted using geographic area probability sampling. Some refer to this as ‘block sampling’. Selecting a sample to represent your targeted population can be tedious work. The method used is referred to as multi-stage sampling. The population frame is first identified by blocks. For instance, you are starting a new business in Cincinnati, and you want to find out how many households have various items. You need to identify the sampling frame. In this case, to make the job cost effective, you divide the city into 1,000 ‘blocks’ based on size so each block has roughly the same number of adults. Within each block there are 250 housing units. In order to get 500 completed interviews, with an estimated 80% completion rate, you first randomly choose 25 blocks, then randomly choose 25 housing units within each block. Once at the housing unit level, the final step is to randomly choose a respondent within the household. | |
| What’s a self-administered survey? | In a self-administered survey, the respondent is directly handed the questionnaire to fill out. Exit polls are examples of self-administered surveys. Voters leaving polling booths are randomly selected to fill out a questionnaire in this type of survey. |
| What is meant by the margin of error? | Most surveys report margin of error in a manner such as: “the results of this survey are accurate at the 95% confidence level plus or minus 3 percentage points.” That is the error that can result from the process of selecting the sample. It suggests what the upper and lower bounds of the results are. Sampling error is the only error that can be quantified, but there are many other errors to which surveys are susceptible. Emphasis on the sampling error does little to address the wide range of other opportunities for something to go wrong. Total Survey Error includes Sampling Error and three other types of errors that you should be aware of when interpreting poll results: Coverage Error, Measurement Error, and Non-Response Error. | |||
| What is sampling error? | Sampling Error is the calculated statistical imprecision due to interviewing a random sample instead of the entire population. The margin of error provides an estimate of how much the results of the sample may differ due to chance when compared to what would have been found if the entire population was interviewed. An annotated example: There are close to 200 million adult U.S. residents. For comparison, let’s say you have a giant jar of 200 million jelly beans. The president has commissioned you to find out how many jelly beans are red, how many are purple, and how many are some other color. Since you have limited funds and time, you opt against counting and sorting all 200 million jelly beans. Instead you randomly select 500 jelly beans of which 30% are red, 10% are purple and 60% are some other color. Looking at the matrix below, you find that with a sample of 500 jelly beans you can report that 30 percent of the jelly beans in the jar are red, +/- 4%. To further elaborate, you can say, with 95% confidence, red jelly beans make up 30% {+/- 4% or the range of 26-34%} of the beans in the jar. Likewise you can report that purple jelly beans make up 10% {+/- 3%or the range of 7-13%} of the beans in the jar. |
Recommended allowance for sampling error of a percentage *
In Percentage Points (at 95 in 100 confidence level)**
Sample Size 9
| n/a | 1,000 | 750 | 500 | 250 | 100 |
| Percentage near 10 | 2% | 2% | 3% | 4% | 6% |
| Percentage near 20 | 3 | 3 | 4 | 5 | 9 |
| Percentage near 30 | 3 | 4 | 4 | 6 | 10 |
| Percentage near 40 | 3 | 4 | 5 | 7 | 10 |
| Percentage near 50 | 3 | 4 | 5 | 7 | 11 |
| Percentage near 60 | 3 | 4 | 5 | 7 | 10 |
| Percentage near 70 | 3 | 4 | 4 | 6 | 10 |
| Percentage near 80 | 3 | 3 | 4 | 5 | 9 |
| Percentage near 90 | 2 | 2 | 3 | 4 | 6 |
| An Important Observation | As the sample size increases, there are diminishing returns in percentage error. At percentages near 50%, the statistical error drops from 7 to 5% as the sample size is increased from 250 to 500. But, if the sample size is increased from 750 to 1,000, the statistical error drops from 4 to 3%. As the sample size rises above 1,000, the decrease in marginal returns is even more noticeable. Notes: Langer Research Associates offers a margin-of-error calculator — MoE Machine — as a convenient tool for data producers and everyday data users. Access the MoE Machine at http://langerresearch.com/moe.php.
| ||
| What is coverage error? | In a typical survey of US adults, some groups of people will not have the opportunity to be included, such a military personnel stationed overseas. This is an example of Coverage Error. That’s the error associated with the inability to contact portions of the population. Telephone surveys usually exclude the homeless and institutionalized populations. This error also includes people who are not home at the time of attempted contact because they are on vacation, living abroad, or otherwise unreachable for the period of time the interviewing (with call backs) takes place. | ||
| What is measurement error? | Measurement Error is error or bias that occurs when surveys do not survey what they intended to measure. This type of error results from flaws in the instrument, question wording, question order, interviewer error, timing, question response options, etc. This is perhaps the most common and most problematic collection of errors faced by the polling industry. | ||
| What happens when people can’t be reached? What about screening calls? | Non-response Error results from not being able to interview people who would be eligible to take the survey. Many households now use voice mail and caller ID to screen calls; other people simply do not want to respond to calls sometimes because the endless stream of telemarketing appeals make them wary of answering. Non-response bias is the difference in responses of those people who complete the survey vs. those who refuse to for any reason. While the error itself cannot be calculated, response rates can be calculated and there are countless ways to do so. The American Association for Public Opinion Research (AAPOR web site) provides recommended procedures for calculating response rates along with helpful tools and related definitions to assist interested researchers. | ||
| What happens when the final sample doesn’t look like the general public? For example, what if three-quarters of your respondents are over fifty? | Survey firms apply a technique called weighting to adjust the poll results to account for possible sample biases caused by specific groups of individuals not responding. The weighting uses known estimates of the total population provided by the Census to adjust the final results. It’s not uncommon to weight data by age, gender, education, race, etc. in order to achieve the correct demographic proportions. | ||
| What about people who only use cell phones? Don’t polls miss them? | There was a time when polls only sampled the population who had landlines. However, as increasing numbers of people have moved to using only cell phones, the industry has had to make changes in methodology. Now, most polls are conducted with both landline and cell-phone samples. |
Data Collection Mode is the phrase used to describe the method by which the selected participants complete the survey. Survey modes include telephone, mail, in-person, or online.
Sampling procedure refers to the process by which researchers choose the respondents for a poll. The methods used can be probability or non-probability-based. A probability-based poll utilizes a randomized selection process where every person in the target population theoretically has an equal chance to be selected as a respondent. In a nonprobability poll, not every member of the target population could be selected to participate, which can introduce bias.
In the earliest days of polling, most polls were conducted using nonprobability quota methods. After roughly 1950, most U.S. polling organizations shifted to probability methods.
Probability-based sampling can be used with any of these modes of data collection. With telephone polling, Random Digit Dialing (RDD) of active U.S. phone exchanges provides nearly comprehensive coverage of the national population and therefore provides a practical way to build a probability-based sample by randomly selecting telephone numbers. Address-Based Sampling (ABS) relies on random selection from the U.S. Postal Service (USPS) Computerized Delivery Sequence File, which also provides nearly complete coverage of residential mailing addresses in the U.S.
But using a probability-based sample to conduct an online survey presents a challenge. There is no comprehensive database of email addresses like there is of mailing addresses or active phone exchanges from which to make a random selection. Email addresses are not tied to residency, and not all Americans have an email address, while many have more than one, making it impossible to create a probability-based sampling frame to represent the total population.
With response rates for telephone polls decreasing dramatically as costs skyrocket, many organizations have decided that polling needs to move online, where contacting people is cheaper. The easiest and cheapest way to conduct online polling is to use a nonprobability-based online panel. Polls using this sampling approach are numerous and popular but risk bias as a result of surveying only that subset of the population who are online and oversampling those who are heavier internet users. These relatively inexpensive polls are based on large panels of respondents who agree to answer surveys, usually in return for small rewards like points that can be exchanged for gift certificates. Panelists can be recruited through email lists, online ads, or other methods. Samples for specific polls are often built using quotas for different demographic groups, and weighting is used to try to make samples representative of the target population.
Researchers who want to retain the advantages of probability-based sampling find a few online options. Online probability panels polls – which are newer, less common and more expensive than nonprobability online polls – use traditional probability-based samples, like ABS, to make the first contact with a respondent or household. Those people who do not have web access are provided such access. A large number of respondents are selected to be a part of the panel, and then random selections are conducted within the panel or subpopulations of the panel to be invited to answer particular surveys.
Several organizations with studies in iPoll conduct polling via online probability panels, including KnowledgePanel (formerly KnowledgeNetworks), NORC AmeriSpeak, the Pew American Trends Panel, the RAND American Life Panel, and the SSRS Probability Panel.
Learn more:
https://aapor.org/publications-resources/education-resources/election-polling-resources/
Once a sample has been selected and respondents contacted, pollsters implement methods intended to improve sample balance. Callbacks in telephone and in-person polls, or reminders or incentives to participate in online polls, can increase participation among those who are less likely to answer the phone or respond to emails. After the fieldwork ends, pollsters use weighting to bring the final sample in line with the national population in terms of sex, race, education, and other characteristics, using Census demographics or other benchmarks. These efforts improve polling accuracy, but nothing can ensure perfect representation.
The most perfectly representative sample in the world can still misrepresent public opinion if the question wording is leading, unbalanced, or simply too confusing. The presence of other questions in the survey instrument and the order in which they are presented can also affect responses. For example, asking political questions before policy questions may prime the respondent to give answers more aligned with their party’s position.
The method used to contact the respondents – telephone calls, mail, web, text messages, in person interviewers, etc. – is called the survey mode. Different modes can lead to different results due to the sampling issues described above, but also because different types of interactions can have different effects on respondents. Questions about highly sensitive topics, like sexual or substance use experiences, might be answered more truthfully when the respondent feels more anonymous. But a well-trained interviewer may be effective at encouraging participation in a poll for a reluctant respondent, thereby reducing overall bias.
In some cases, different field organizations can get different results for the same survey questions using similar polling methods. This can be attributed to several factors, like choice of weighting demographics, number of callbacks or reminders used, visual design on an online polling instrument, or interviewer training. One example of interviewer training differences can be found in accepting “don’t know” as a volunteered response. Some organizations may ask their interviewers to probe for an answer before accepting “don’t know,” while others allow interviewers to accept a don’t know response immediately. The same question of the same population might therefore result in differing levels of “don’t know” response.
There are some tables that are straightforward. The Roper Center’s iPoll database offers the topline results to survey questions–toplines are how the full aggregated sample answered the questions.
iPoll example:
You might say that the public is evenly split on judging the integrity of pollsters, according to this November 2002 telephone conducted by Harris Interactive and obtained from the Roper Center at the Cornell University.
| Harris Poll [November, 2002] |
| Would you generally trust each of the following types of people to tell the truth, or not? …Pollsters |
| 44% Would trust |
| 43% Would not |
| 13% Not sure/Refused |
| Methodology: Conducted by Harris Interactive, November 14-November 18, 2002 and based on telephone interviews with a national adult sample of 1,010. [USHARRIS.112702.R1O] |
| Data provided by The Roper Center for Public Opinion Research, Cornell University. |
Cross-tabulation tables can be more complicated. Crosstabs offer a look at how different groups within the sample answered the question. In other words, the table below can be summarized in this manner:
A New York Times poll in June 2000 found that among whites, 81% thought race relations in their community were “good”, while 72% of black respondents found this to be the case. Conversely, 14% of whites and 22% of blacks identified their community race relations as “bad”. Among those who identified with the “other” race category, 79% responded good and 18% bad to the question of race relations in their community. There were too few Asians in the sample to be able to statistically rely upon the percentages. These data were provided by the Roper Center at the Cornell University.
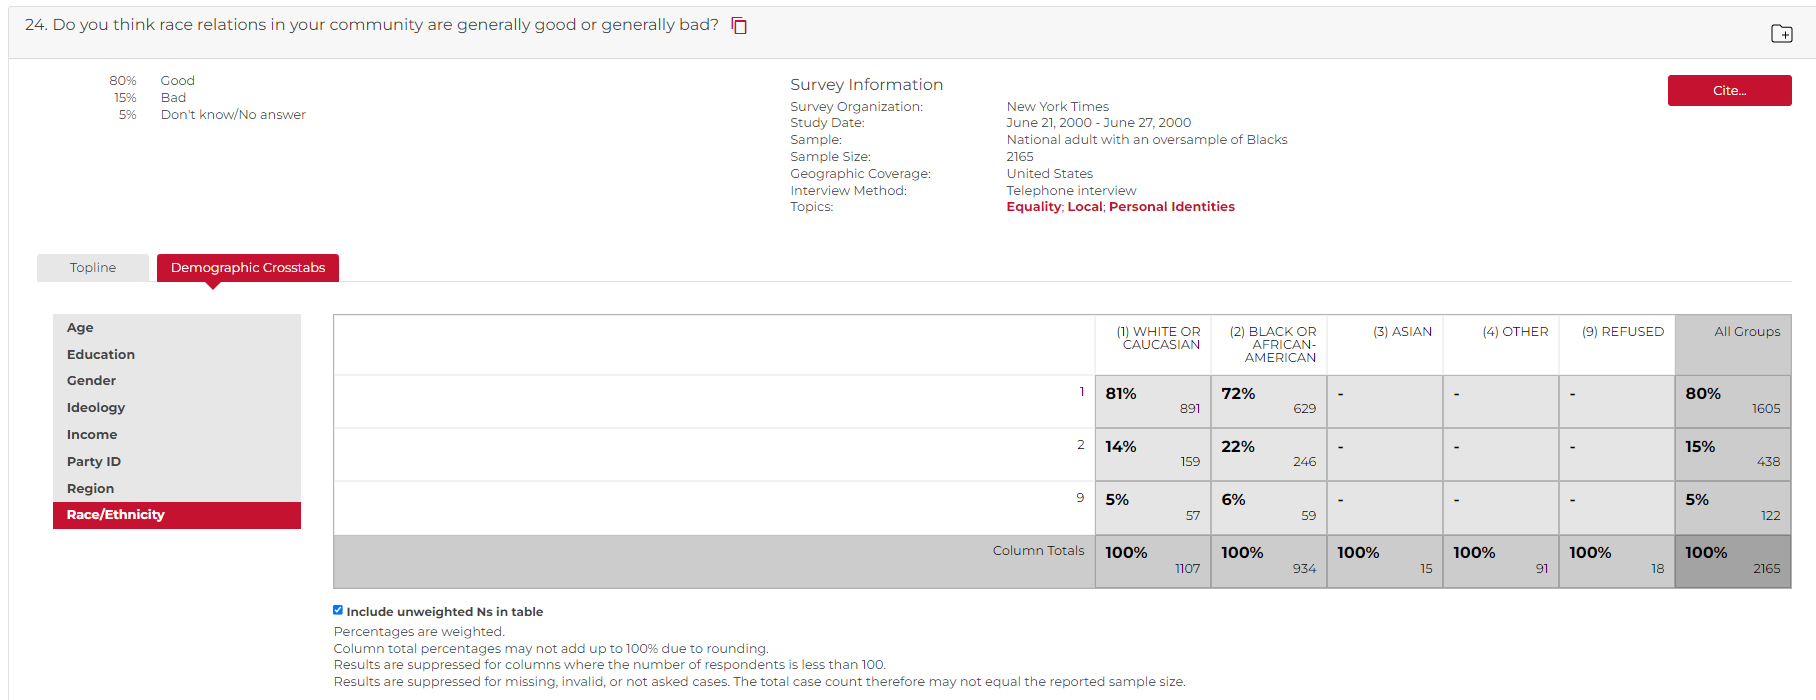
Source: New York Times Poll, Race Relations in America, June 2000
Data provided by the Roper Center at the Cornell University.
For further information, please contact The Roper Center at 607.255.8129 or Support at Roper.