By Tevfik Murat Yildirim and Laron K. Williams
1 Introduction
The question of ‘what is the most important problem (MIP) facing the country?’ is perhaps one of the survey questions that has been asked most consistently since the start of modern polling. Since then, MIP questions have been used to measure the public’s policy priorities and issue salience, and received utmost scholarly attention in public opinion research. Despite their wide use in political science research, however, answers given to the MIP questions were previously not comparable across time and space. The Most Important Problem Dataset (MIPD) that was introduced in 2017 and distributed by Roper Center represented the first attempt to provide comparable data on issue priorities by coding open-ended responses into issue categories. The original MIPD has been widely used by political scientists and has helped answer questions about public policy priorities, issue congruence, voting behavior, partisan fragmentation, and more.
We introduce the second release of the MIPD, which offers valuable opportunities for even more detailed analysis. In this brief blog post, we draw on our data article and summarize some of the key features and innovations. The updated MIPD switches from coding responses to quasi-responses, extends the time period covered in the data from 1939 through 2020, introduces a new coding scheme that allows for more fine-grained analysis, and includes data on state-level identifiers to allow for state-level aggregation of the data. Below are the key improvements made in this latest release, which we believe will enhance its use by researchers and analysts alike.
2 Key Features and Novelties
2.1 Coding Quasi-Responses for Greater Precision
One of the main limitations of the original dataset was that each respondent’s answer was coded into a single category, even if the response contained multiple relevant issues. This has been a common practice in coding open-ended survey answers. Due to space constraints, polling agencies were often forced to categorize answers to the open-ended Most Important Problem question into seemingly relevant groups. For example, a response like “inflation and unemployment” was categorized under one issue, despite reflecting concern for both. In some extreme cases, polling agencies coded mentions related drugs as “morality/drugs,” which is problematic as this distorts the picture of concerns given by the respondent. To address this, the updated dataset introduces quasi-responses, for which we separately coded each distinct issue mentioned in a respondent’s answer. This allows for a more accurate representation of the public’s priorities and providing a clearer understanding of how individuals think about and express multiple concerns. Moreover, researchers will now have the opportunity to group issues into their own preferred categories, or weight the importance of mentions. For example, although a response given a value of “taxes, unemployment, and inflation” will have 100% of the codes attributed to the general category of ‘Economy’, at the sub-level this answer is about taxes (1/3), unemployment (1/3) and inflation (1/3).
2.2 Expanded Coding Scheme and Time Coverage
The new version of the MIPD now categorizes responses into 110 distinct issue areas, up from the original dataset’s more limited coding scheme. This expansion allows for more nuanced analysis across a wider range of topics, including issues like immigration, education, and environmental concerns. Importantly, the dataset remains flexible, allowing users to aggregate or disaggregate categories based on their research focus. We also added information about the geographical focus of the answer, when this information is available. For instance, mentions of war, foreign policy and international trade often have a geographical focus in answers (e.g., “the war in Afghanistan”). Finally, we also added information about the direction of preferences mentioned in MIP responses. Especially on issues related to spending, respondents often specify whether ‘too much spending’ or ‘too little spending’ is the most important problem facing the country.
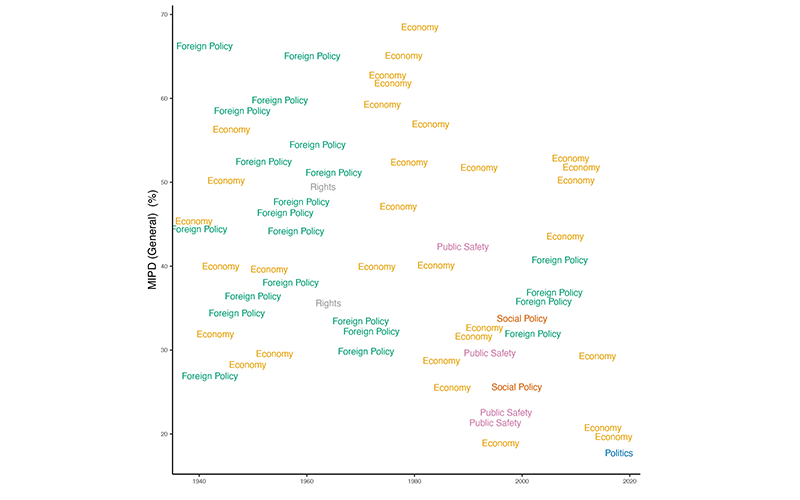
Additionally, the original MIPD only coded surveys up until 2015, missing key opportunities to examine important events such as the election of Donald Trump and the coronavirus pandemic, both of which significantly impacted American politics. We extended the time period covered in the data through 2020, and included additional surveys from other years. The resulting dataset includes respondents from around 850 surveys, which was nearly 670 in the original MIPD. We present below (Figure 1) the most commonly mentioned issue categories in specific years over the past eight decades.
2.3 State-level Policy Priorities
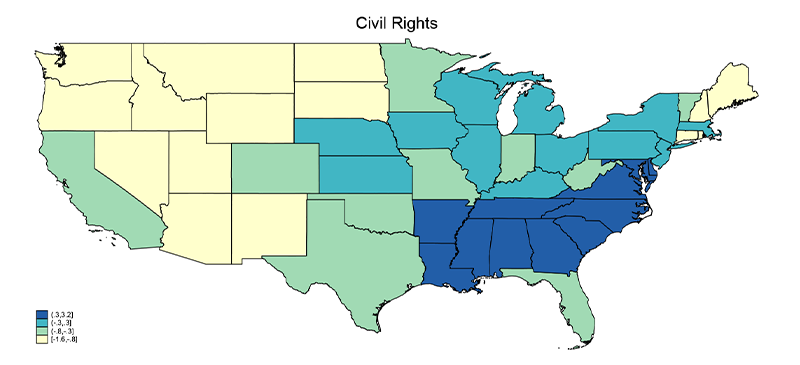
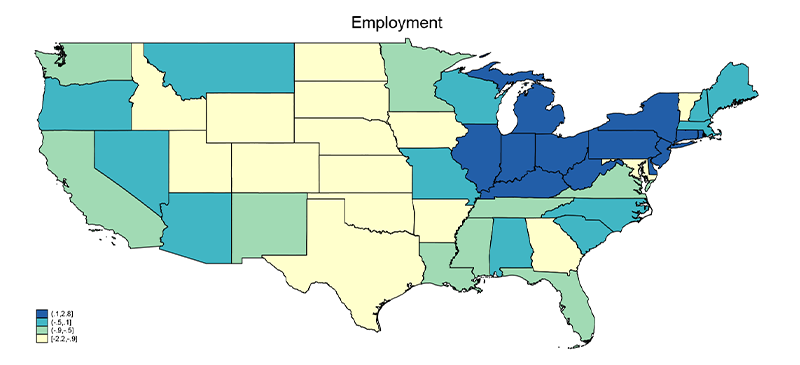
The new version of the MIPD now includes information about the state in which the interview took place. Of the 1,043,060 respondents, nearly 890,000 have information on state identifier. This allows researchers to aggregate the data by states across time. In addition to policy priority questions, the MIPD also includes various political and demographic variables, which can be aggregated by states. Below we present two figures that illustrate mentions of issues related to civil rights (Figure 2) and employment (Figure 3) across states. Darker colors represent those states where that issue – either civil rights or employment – are disproportionately more important than the national average. As expected, the figures show that the public’s issue importance regarding civil rights and employment is geographically clustered.

The novelties in the updated MIPD open up new avenues for research. For example, scholars can now explore how policy priorities have shifted across states and time periods, or how specific demographic groups prioritize different issues. By offering this level of detail, the dataset is a powerful tool for studying the dynamics of public opinion, especially in light of major political events like the election of Donald Trump and the COVID-19 pandemic.


3 Suggestions for Future Research
The MIPD includes comparable data on respondents’ policy priorities, demographic and political background, vote intention, political interest, economic evaluations, among others. It also includes information about the date of fieldwork and interview methodology used in each survey. This allows researchers to examine, for example, the impact of major policy shocks (e.g., major changes in policy) on public opinion. It is also possible to merge the MIPD dataset with various other datasets. One possibility is to merge state-level data from The Correlates of State Policy dataset to explore local level predictors of issue salience.1 Other possibilities include merging state- or aggregate-level economic and other policy performance indicators to delve into how policy outcomes shape the public’s policy priorities. Researchers who are interested in tracking issue importance in the aggregate – or across subgroups like gender, income or partisanship – can utilize the aggregate data. We are particularly excited to see the innovative ways that scholars use these data, either individually or in the aggregate.
1Grossmann, M., Jordan, M., & McCrain, J. (2021). The Correlates of State Policy and the Structure of State Panel Data. State Politics & Policy Quarterly, 1-21.