Are Donald Trump and Hillary Clinton the least-liked presidential candidates in recent history? There’s evidence they may be. Trump’s unfavorability ratings have been declining over the last few weeks, but the most recent Gallup poll still placed his unfavorables at 60%, with Clinton’s a lower but still dismal 54%. Other polls have found higher negatives still. Just how bad are these numbers? A review of more than two thousand questions about feelings towards candidates from the historical polling data in the Roper Center public opinion archives indicates that they are very bad indeed.
What was the question, who was asked, and when?
Three major factors need to be considered when making comparisons about ratings of candidates from polls in earlier elections: question wording, sample, and timing. Since 1980, most opinion polls have asked some variation of the question: “Do you have a favorable or unfavorable impression of Candidate X?” Although precise wording varies from poll to poll, such questions produce similar results. Some polling organizations explicitly offer respondents the option of saying they haven’t heard enough to say, while others allow “don’t know” only as a volunteered response. The former generally produce lower favorables and unfavorables, as more of the public choose not to take a position.
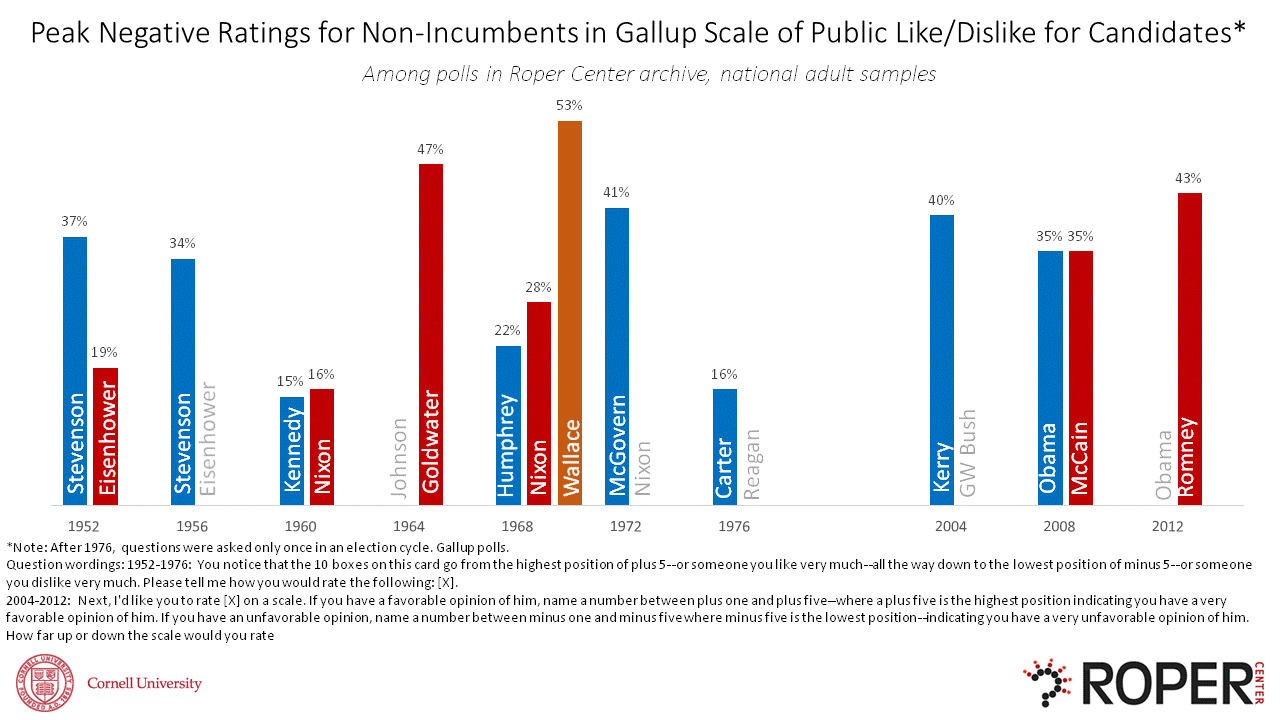
Before 1980, this favorability question was not asked about non-incumbent candidates. Instead, from 1952 through the 1970's, Gallup measured the public’s positive or negative impression of candidates with a question that asked respondents to rate their feelings towards a candidate on a scale from minus five to plus five, where minus five was “dislike very much” and plus five was “like very much.” Gallup has occasionally asked a version of this question in more recent elections.
Polling organizations gauged feelings towards candidates using national adult, registered voter, and likely voter samples. As these populations vary considerable in demographics and political attitudes, generally comparisons of results should not be made across groups. National adult samples provide the most accurate comparisons across polling organizations, while polls of likely are more problematic, as likely voters are defined in very different ways by different pollsters, introducing inconsistency. For this reason, this review focused on polls of national adult samples. However, polls did not show large differences between likely voter and national adult samples on favorability measures.
The point in the election cycle when a poll is taken also matters. In order to limit the number of questions under consideration to about 2500, the review only covered favorability measures put to the public between the official nominations at the conventions until election day. While it is possible that a higher candidate unfavorable might have been found in some poll from earlier in the campaign cycle, it is quite unlikely for a simple reason: larger “don’t know” responses in the early days of a campaign tend to bring down both favorables and unfavorables. The public’s high familiarity with both Donald Trump and Hillary Clinton makes the 2016 election unusual in this regard.
Thumbs down
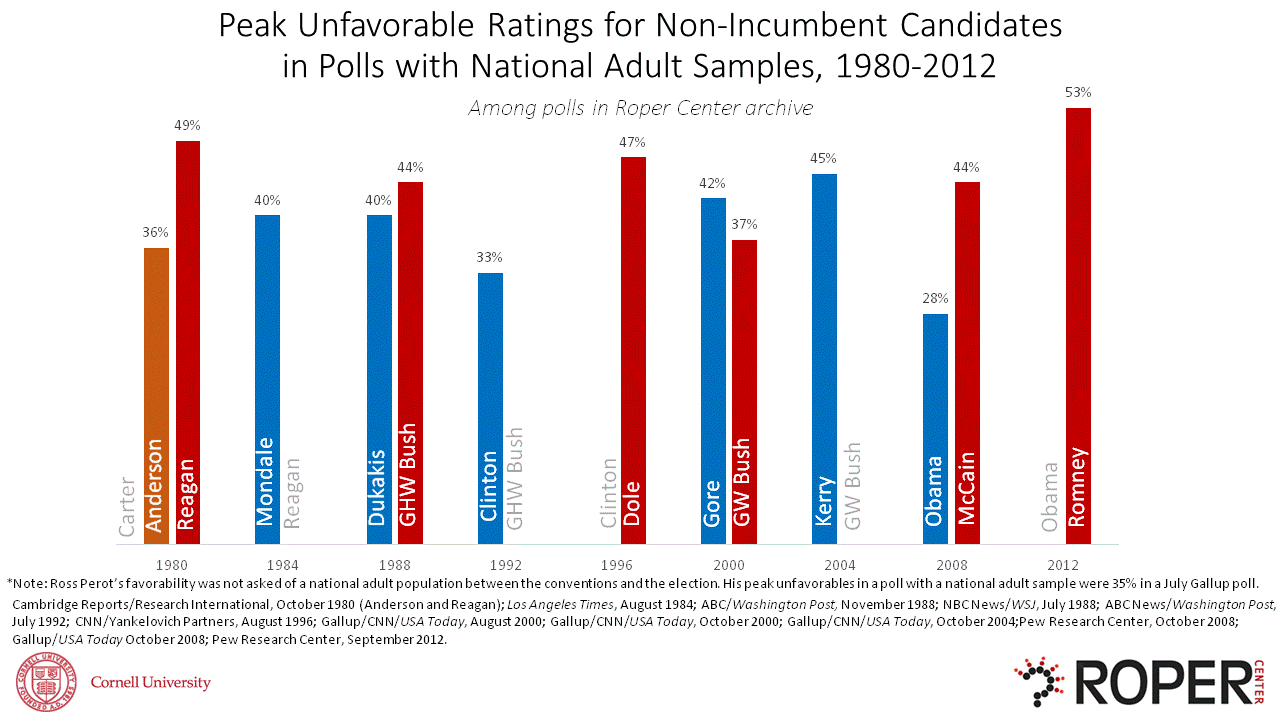
The highest negative rating in a favorable/unfavorable opinion question among a national adult sample between nomination and convention was 53% for Romney in a September 2012 Pew poll.

In some cases, limiting inclusion to polls with national adult samples may have removed the highest negative result. For example, Dukakis had a peak unfavorable of 40% among the national adult population in a November poll, but had a 48% unfavorable among likely voters in an October NBC/WSJ poll. Typically, fewer national adult samples were collected close to the election during some years, decreasing the opportunities for peak negative ratings. However, in our review, even among likely voters, no non-incumbent candidates reached 55% unfavorable in any poll before Trump and Clinton.
Going back further in time with the Gallup minus five-plus five question, the highest negative feelings toward a candidate were found in an October 1968 poll. George Wallace, who ran in that election as the American Independent Party candidate, was rated negatively by 53% of the population. This plus five-minus five question was only asked once in the 2012 election, but Romney’s negatives were only 43%, below his lowest ratings in the favorability question.

Comparisons between the favorability and liking questions are certainly not exact. However, it seems fair to say that negative feelings about presidential candidates have not been recorded in the high 50's or low 60's range seen for Trump and Clinton since pollsters began attempting to measure such attitudes in 1952.
Kathleen Weldon, Director of Member Relations and Communications, and Carl Brown, iPOLL Acquisitions Manager, collaborated on this analysis.
