On May 14, 1882, unionized workers in New York City held a parade and picnic, and the seeds of the Labor Day holiday were planted. About 50 years later, pollsters began asking Americans to share their opinions on labor unions. The results highlight how views of the labor movement have — and haven’t — changed since the 1930s. Some insights from the Roper Center for Public Opinion Research archives.
Public Approval of Organized Labor
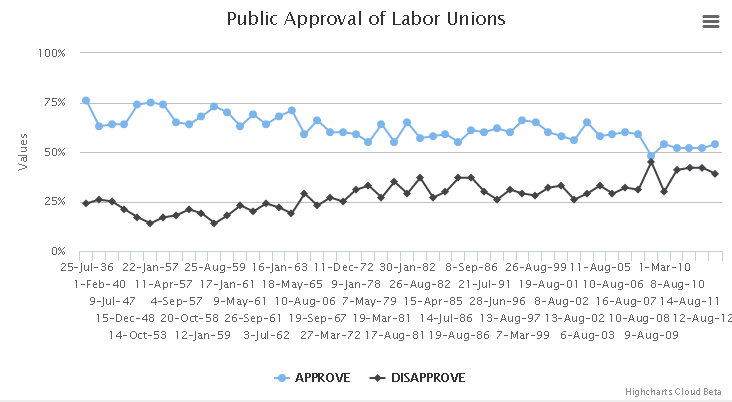
Gallup has been asking the public about their approval of labor unions since 1936. Support for unions has drifted slowly downward since its early peaks. However majorities (54%) still express approval in the most recent poll.
Labor unions, yes — Union leaders, no
Despite continued majority support for labor unions overall, the public has consistently reported negative associations with union leaders. In the McCarthy era, Americans expressed concern about communist infiltration of union leadership, with 64% in a 1954 Opinion Research Corporation survey believing there were “quite a few” people holding important jobs in unions who worked for the communists.
“The public’s general approval of unions has diminished, but there remains a core level of support,” said Paul Herrnson, a Professor of Political Science at the University of Connecticut. “The negative attributes associated with union leaders, however, impede unions’ ability to garner more public approval.”
Americans may no longer fear communism in labor leadership, but perceptions of corruption and racketeering have proven more persistent. In 1957, when Teamsters President Dave Beck pleaded the Fifth 117 times before the Senate Select Committee on Improper Activities in Labor and Management, 43% of the public in a Gallup poll said that corruption and graft was widespread in unions. Harris questions from the 1970s to 1990s found majorities or near-majorities believed many union leaders had known ties to organized crime and racketeers, were not to be trusted to tell the truth, and abused union funds. Ratings of the honesty and ethical standards of labor leaders as high or very high have stayed in the low-to-mid teens over forty years of Gallup polling, with the apex of recent years an underwhelming 17%.
“The public’s general approval of unions has diminished, but there remains a core level of support,” said Paul Herrnson. “The negative attributes associated with union leaders, however, impede unions’ ability to garner more public approval.”
The public and the striking worker
Over 1950s, 1990s, and early 2000s, the public was asked by Gallup where their sympathies generally fell when they heard about a strike. Over this broad time span, the number inclined to side with the union has stayed fairly consistent, ranging from 40% to 52%. Those who tend to side with the company has ranged between 29% and 37%, while the remainder say neither or both.
Data from polls conducted during specific high-profile labor disputes since 1945, however, indicate that actual strikes are judged on a case-by-case basis, with sympathies swinging widely between employees and company. In recent years, the public has been more likely to support lower-paid strikers like bus drivers and delivery people than professional athletes with big salaries. Firm majorities favored the union in the 1990 Greyhound strike (53%, Time/CNN/Yankelovich Clancy Shulman), 1997 UPS strike (52%, CBS News) and 2007 TV writers’ strike (60%, Gallup/USA Today). In the 1995 baseball strike, support for the strikers was much lower (24%, Gallup/CNN/USA Today).
Union members, then and now
Gallup polls reveal major changes in union membership levels. In 1937, 11% of all adults reported belonging to one. By the early fifties, when the proportion of the employed in unions was reaching its peak, membership was at 18%. Labor membership suffered a long decline over the late 20th century, and by 2014, again one in ten said they were union members.
These polls show significant shifts in the demographics of union members. Between 1937 and 1952, women’s membership more than doubled from 3% to 7%, increasing faster than their rate of entrance into the workforce. In 2014, just over one in ten women report belonging to a union. Similarly, one in ten college grads today report being union members, double the number that said so in 1952 when overall union membership was near its peak. But some things don’t change: in the South, the only region where membership decreased between the 1937 and 1952 Gallup polls, membership remains very low.

Perhaps the most telling changes in the relationship between the public and unions are revealed not by answers to polls, but by the questions asked. In the early years of polling, Gallup, ORC and the Roper organizations routinely asked Americans to express opinions on labor matters, including what would now be considered somewhat arcane policy distinctions. The Roper Center archive holds over 1100 such labor questions from the 1940s alone. But from the 2000s, when the overall number of polling questions had increased more than twelvefold, there are just 515.

Sources
- Roper Center for Public Opinion Research archives
- Specific collections include Gallup, ORC, Harris, Wisconsin Public Television, Gallup/CNN/USA Today, CBS News, ABC News, AP.
Date Published: August 29, 2014