To help ease this situation, The Roper Center for Public Opinion Research has partnered with the Cornell Center for Social Sciences to locate and identify Black American data. This guide is intended to help public opinion researchers identify polls that will provide sufficient samples for analyzing Black American public opinion. For a historical overview of Black American public opinion polling, including Roper Center polls focused on Black Americans, we invite you to visit here: Researching Black American Public Opinion
Sample Size
If samples perfectly reflected the population, a current 2022 poll of 1000 Americans would include 124 Black respondents, based on Census figures. During the early years of public opinion polling in the 1930s and 1940s, Black Americans would have represented about 10% of the total population. But for various reasons, most polls have underrepresented the Black population. In some early polling, this was by design. For instance, in many parts of the country and particularly in the South, Black Americans were systemically excluded from voting access. Around that time, the Gallup Organization depended heavily on electoral participation as a control in their polling, which was intended to represent a population with political and economic influence, causing Black Americans to be systematically underrepresented. Most of the time, however, Black Americans have been underrepresented in polling because longstanding survey methods have a poor track-record of reaching this group relative to others. For example, Black Americans are younger on average than white[1] Americans, and young people are generally less likely to respond to telephone polls. As a result, a 1000-person national poll might include just 85-95 Black respondents, fewer than the 100-person sample most researchers consider the minimum for analysis.
Larger sample sizes can help address the challenge of lower response rates. The earliest public opinion polls, which used quota methods, often had very large samples of 3,000 or more. As a result, polling firms that were trying to represent the entire public, not just the influential, often included a sufficient number of Black respondents for analysis purposes. The shift towards more expensive probability-based polling after the 1948 election—a change that unfolded slowly over three decades—resulted in decreased sample sizes and fewer usable Black samples. (See some examples of subgroup analysis by demographic in smaller samples here.)
Still, some organizations recruited large samples despite increased costs. Roper Reports and CBS News, for example, often interviewed over 1500 respondents in the 1970s and 1980s.
Click here to download a complete chart with examples from each decade from 1940-2020.
While current national polls generally include between 1000 and 1200 respondents, some are much larger. These include multi-year, federally funded projects like the Cooperative Election Study and media voting polls like the National Election Pool’s National Exit Polls and the AP Votecast series. These projects incorporate online sampling, making larger samples more affordable.
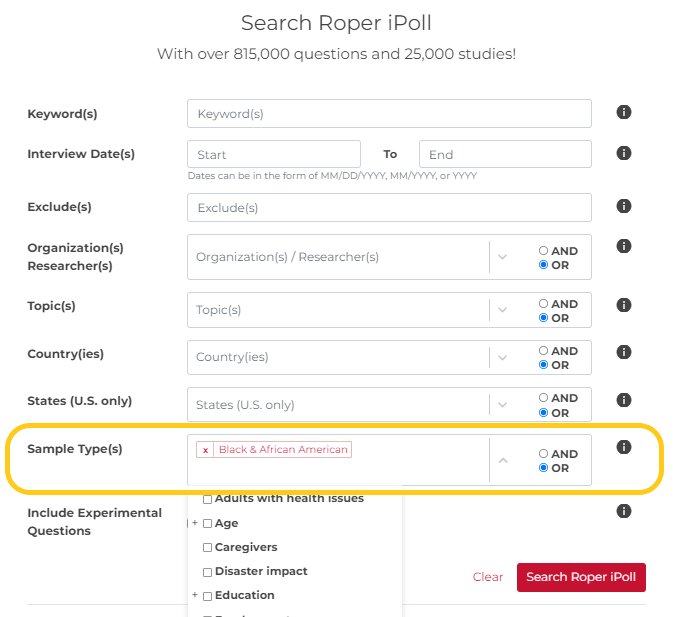
Oversampling Black Americans is another useful strategy. The General Electric Trendex survey series was one of the first to do this, but currently organizations like KFF, AARP, and Pew often include an oversample of Black respondents, while other polls do so when researchers intend to analyze results by race. The Sample Type search and filter field in iPoll will identify both Black samples and oversamples.
Given the limited number of Black samples of sufficient size for analysis, creating tracking over-time change can be particularly challenging. The General Social Survey, which has fielded many of the same questions with each wave since 1972, is one of the best sources for trends. The General Electric Trendex series also repeated many questions over its span. Some example trends from GE and other organizations can be viewed by clicking here.
Racial Identification: Self-identified by Respondent or Coded by the Interviewer?
Another challenge concerns changes in the ways that respondent race was reported. Polling was mainly conducted face-to-face until the 1970s, when Warren Mitofsky helped pioneer Random Digit Dial (RDD) telephone polling. Nearly all face-to-face polls relied on interviewer observation to code respondent race; therefore, racial categories reflected interviewer perceptions, not respondent’s self-identity. Again, the transition to telephone mode did not happen overnight, and some major polling series that continued in person relied on interviewers’ perceptions of respondents’ race for much longer. The General Social Survey, for example, followed this approach in their in-person surveys until 2000, when they began asking respondents to identify their own racial categories.
Racial Categories: Changing Approaches
The racial categories made available within a poll have also changed over time. In the earliest years, polls commonly offered only two options for race: white or “Negro”/“Colored.” NORC specifically trained interviewers to code all racial minorities other than African Americans as white. Race and socioeconomic status were collapsed into a single variable by both NORC and the Roper Organization. NORC’s categories included five levels of socio-economic status for whites, from A to D and “On Relief,” while “Colored” respondents could be coded as only On Relief or not. The Roper Organization had an even starker set of categories: whites could be coded at economic levels A through D, while “Negroes” were not granted any form of economic ranking, a practice that ended in 1945. For detailed information on racial categorization in specific early polls in the Roper Center collection, see the Historical Methods tab on the study record.

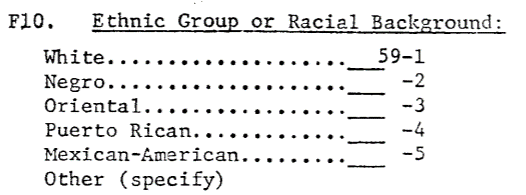
By the 1960s, changes were underway. Many pollsters began including an “Other” option instead of offering a binary racial distinction, but racial and ethnic identity categories remained limited. Although some state polls included categories for groups with higher proportional representation in their state, few national pollsters provided this level of granularity.[2] There were two notable exceptions. General Electric’s 1968-1971 Black oversample survey series recorded the different ways that Black people described themselves, accepting “Black or Negro,” “colored,” and “Afro-American” as responses. The Harris Poll did not provide multiple options for Black identity but did include an Asian American (“Oriental”) category in the 1960s, as well as Mexican and Puerto Rican categories.

Louis Harris and Associates, Inc., 2008, "Harris 1969 Media Public Opinion Survey, study no. 1936", https://hdl.handle.net/1902.29/H-1936, UNC Dataverse, V1.
The first national exit poll by CBS News included “Mexican” as a category in California, “Puerto Rican” in New York, and “Spanish” elsewhere. Because these categories were presented within the general racial category questions, Black Latinos were made to select a single identity. As Latino ethnicity became more common in polling demographics during the 1970s and 1980s, some organizations continued this practice, while others asked about ethnicity and race separately. When the Census began allowing respondents to select more than one racial category in 2000, some pollsters followed suit, so that mixed-race individuals could also choose the options that best represented how they identify. While this approach more accurately represents intersectional identities, it creates a challenge for researchers wanting to compare groups over time, since it is not clear how many people selecting “Black” in earlier polls might have chosen additional identities if they had been offered the option.
Learn more about other noteworthy Black American opinion data providers and their polls from the 60s and 70s by clicking here.
Approaches for Working with Smaller Samples
Combining data across multiple surveys is another tool to consider for understanding the opinions of Black Americans. Ex-post harmonization of surveys is the process of bringing together diverse surveys to fill research gaps in data. Techniques to harmonize existing data have been used on very large multi-country surveys for decades, but these same techniques can also be used to merge polling datasets with common questions to increase the sample size of small and unrepresented subpopulations. Because polls often measure attitudes that can change in response to unfolding events, caution must be taken in pooling polls conducted during different field periods. See some example trends created from these samples by the Roper Center by clicking here. More information on this ex-post survey harmonization can be found in the following resources:
The sum and its parts: The benefits of combining data from different surveys (GESIS)
Dubrow J.K., Ilinca C. (2019) Quantitative Approaches to Intersectionality: New Methodological Directions and Implications for Policy Analysis. In: Hankivsky O., Jordan-Zachery J. (eds) The Palgrave Handbook of Intersectionality in Public Policy. The Politics of Intersectionality. Palgrave Macmillan, Cham. https://doi.org/10.1007/978-3-319-98473-5_8
Wysmułek, I., Tomescu-Dubrow, I. & Kwak, J. Ex-post harmonization of cross-national survey data: advances in methodological and substantive inquiries. Qual Quant (2021). https://doi.org/10.1007/s11135-021-01187-7
More information
General Social Survey GSS Explorer: Race of respondent variable: https://gssdataexplorer.norc.org/variables/82/vshow
US Census: Measuring Race and Ethnicity Across the Decades: 1790–2010
https://www.census.gov/data-tools/demo/race/MREAD_1790_2010.html
[1] At the time of writing in February 2021, the debate over whether to capitalize “white” is ongoing. Compelling arguments for and against have been put forward. Roper Center follows the guidance of Cornell University’s Research Division in choosing to capitalize “Black,” but not “white.” However, as this review of changing understandings of racial identity so clearly illustrates, decisions about language are not and should not be static, but must continue to evolve.
[2] Some state polls in heavily white states, like the Iowa Poll, had no race variable. However, the Texas Poll included the race options “Anglo,” “Latin,” and “Negro.” Crossley’s 1944 New York election poll had perhaps the most unusual set of racial categories seen in U.S. polling: “Negro,” “Hebrew”, “Polish,” “Italian,” “Other.”